Meta-Analyses Show "What the Research Says" Even Though All Studies Don't Say the Same Thing
.Here's How to Understand Them
Edited 2/18/24, replacing the main image and making small text edits, and on 2/19/24 to fix a typo noticed by an alert reader. Sorry for the repeated emails!
Usually, in research, individual studies on the same question will provide different answers. Some studies will show an effect, others none at all. Some studies will show a big effect, others a small one. That’s normal, and expected.
So, how do we figure out “what the research says” when all the studies don’t say the same thing?
Sometimes, the overall pattern is clear enough to see easily. For example, there is probably a positive effect if:
Most or all of the studies show a positive effect;
At most a few studies show no effect;
At most 1 or 2 lower-quality studies show a negative effect.
However, the pattern isn’t always so clear — especially when there are small numbers of studies that differ in methods.
Furthermore, sometimes we don’t just want to know if an effect exists; we also want to know how big it is. For example, how much does Curriculum X raise 8th graders’ reading test scores?
In these situations, we need math, so we do a meta-analysis.
Meta-analyses take the data from all the studies on a research question and analyze them together to determine the likely size and direction of an effect.
For example, suppose you want to know whether transcranial magnetic stimulation (TMS) reduces the symptoms of people with severe depression. Meta-analyses show whether the effect of TMS, across all the studies, is positive, negative, or neutral. That is, after finishing treatment, do people feel less depressed, more depressed, or the same?
Meta-analyses also estimate the size of the effect: how much does TMS reduce depression symptoms?
Knowing the size of the effect helps you decide how much it matters in real life.
What might effect size look like in real-world terms? If the effect is large, some patients might no longer have depression after treatment. If the effect is small, you might see small changes in whatever measure of depression the researchers use. Maybe people experience symptoms 1 fewer day per week, or score 1 point better on a standard depression questionnaire.
Meta-analyses also include secondary analyses that answer questions like these:
How consistently do the results apply across studies? Inconsistency – called “heterogeneity” – suggests that there could be meaningful characteristics of the participants or the treatment that affect the results.
What characteristics of the participants or treatment predict whether, or how much, it helps? (For example, do depression severity, or length of treatment, predict how much patients benefit from TMS?)
How likely is there to be “publication bias”—that is, studies that show a statistically significant effect are published while those showing no effect are not?
It helps to know that these secondary analyses exist. However, you’ll rarely see them discussed. So, this post will focus on the main analysis.
Why Meta-Analyses are the Best Quality Source of Evidence
People talk about “science” as if it were a monolith. In fact, it includes multiple sources of information that differ in quality and trustworthiness.

In other words:
You can have more confidence in the results of a research study than the opinion of a scientist, however prominent.
You can have more confidence in a randomized, controlled experiment (called a “randomized controlled trial” or “RCT”) than other kinds of studies.
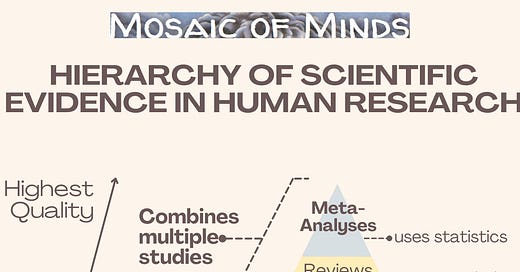
You can have more confidence in syntheses of studies, such as narrative reviews and practice guidelines, than in single studies. Meta-analyses add statistical analyses, making them the best evidence of all.
Why?
More Participants is Better
Meta-analyses pool data from many small studies to create a large sample. More participants is better. To better understand why, let’s look at the underlying probability principles, using a fair coin.

Similarly (to the extent that selecting participants is random), you can think of each participant as a coin flip, and your outcome of interest as the number of heads. The more “samples” you take, the more closely the result of your study will match the value in the population.
What is the population? That depends on the research question. If you want to know if TMS helps people with severe depression, your population is people with severe depression. If you want to know whether Curriculum X raises eighth graders’ reading scores, your population is eighth graders in whatever school system(s) you choose.
When you flip a fair coin, you know the true number of heads is ½ the number of flips. The “true value” in a human population varies. The more participants you sample, the better you can estimate that value. Suppose your effect of interest happens an average of 90% of the time in the population. The more participants you sample, the closer to 90% your study result is likely to be.
In practice, obtaining a large sample of participants is time-consuming and expensive. It’s much easier to analyze data already collected by multiple smaller studies. Large multi-site research projects take this approach. When all the labs follow the same protocol, they’re doing the same study. So, the number of participants in the whole study is the sum of the participants at all the locations.
Meta-analyses typically have more participants than would be recruited in any individual study. That means they can estimate an effect more accurately.
The More Studies the Better
A meta-analysis is more than just a big study. A meta analysis has less irrelevant variation and noise, and matches the population more closely, than any single study (even a really big one).
Just as each participant in a study is randomly sampled from the population, so each study is also a random sample of the population. If you conducted another study, taking a different random sample of people, you might get a different result.
The more studies you conduct, the more closely you can estimate the “true answer” in the population. That’s one reason why it’s important to repeat (“replicate”) studies.
The consistency of the effect matters. An effect is more likely to be real if it holds up across different study methods, participant characteristics, locations, even languages and cultures.
The more studies find the same result, the more likely it is to be real — not the result of either chance or some other, “confounding” variable.
Meta-Analyses Take Into Account Both the Number of Participants and the Number of Studies
Imagine you want to do a meta analysis. Let’s say you want to know how Curriculum X changes 8th graders’ reading test scores. You have scores for Curriculum X and the control condition from 2000 participants in 10 different studies. You could find the average result for those 2,000 participants, as if they were all part of one big study.
In fact, researchers don’t do that – because they don’t want each study to contribute equally to the outcome.
A study with more participants better represents the population, so it should have more influence over the results of the meta-analysis.
Thus, meta-analyses use a “weighted average.” Each study’s weight depends on its number of participants. Research papers will list the weight of each study in the meta-analysis, usually in the main figure.
Go forth and weigh evidence
In short, a meta-analysis summarizes the state of knowledge in a research area. Using statistics, researchers discover what all existing studies say about a research question. Do we observe an effect, the opposite, or none at all? If an effect exists, how big is it?
Thanks to meta analyses, we can draw conclusions about “what research shows,” even though individual studies say different things.
These ideas are the foundation you need to understand and use evidence from meta-analyses.
You now have context to understand discussions of meta-analyses in the news or policy debates. You know why meta-analyses are the most convincing type of evidence, and are prepared to believe claims from meta-analyses over single studies.
If someone says, “science shows X,” you can ask if they’re talking about a meta-analysis.
If you want to learn more about meta-analyses and get a sneak peek at the topics of future posts, keep reading past the buttons.
What’s Next?
Of course, there’s a lot more worth knowing about meta-analyses.
Process
Creating a meta-analysis is a process. Knowing that process deepens our understanding of meta-analyses. Stay tuned for a post which will walk through these steps. Using a real meta-analysis on meditation in ADHD as an example, I’ll talk about how researchers develop their question, find the relevant studies, and determine what the results show.
Quality
In practice, meta-analyses vary in quality, just like individual studies do. The quality of a meta-analysis depends on both its own characteristics and the quality of the individual studies it uses. When people don’t like the conclusions of a meta-analysis, they will often point out its flaws. To help you evaluate such criticisms, I’m working on another post that delves more deeply into meta-analysis quality.
How to Read
Finally, if you’re interested in reading meta-analyses yourself, you’ll need to understand certain statistical concepts (such as “effect size”). You also need to know how to interpret the main figure meta-analyses use: a “forest plot.” I’m working on an explanation of exactly that.
…
Do you have any questions about meta-analyses in general, or any particular one? Is there a specific meta-analysis about the brain or neurodivergence that you’d like me to discuss in future posts? Let me know in the comments.
Questions? Comments? Corrections? Polite disagreement? Experiences to share? Hit the comment button below and be heard.


